


Consistently ranked among the best in the nation, this clinical science program emphasizes the integration of research and practice in training, activities and experience, bringing together the rich scholarly resources and offerings of a Department of Psychology located in a College of Sciences (SDSU) and a Department of Psychiatry located in a School of Medicine (UC San Diego).
Students are actively involved in clinical research activities throughout their stay in the program. We regard the development of research skills and attitudes as a basic feature in the training of clinical psychologists who will have duties encompassing teaching, research, diagnosis, treatment, consultation, and program evaluation and design, and who will need to apply research skills and knowledge to varied content areas and settings.
The SDSU/UC San Diego Joint Doctoral Program in Clinical Psychology has been consistently accredited by the American Psychological Association (APA) since 1990. See Student Admissions, Outcome, and Other Data.
Major Areas of Study

Behavioral Medicine
Study the effectiveness of interventions for chronic health conditions like cancer, HIV and diabetes.

Experimental Psychopathology
Inform treatment of anxiety, PTSD, schizophrenia and affective disorders in children and adults.
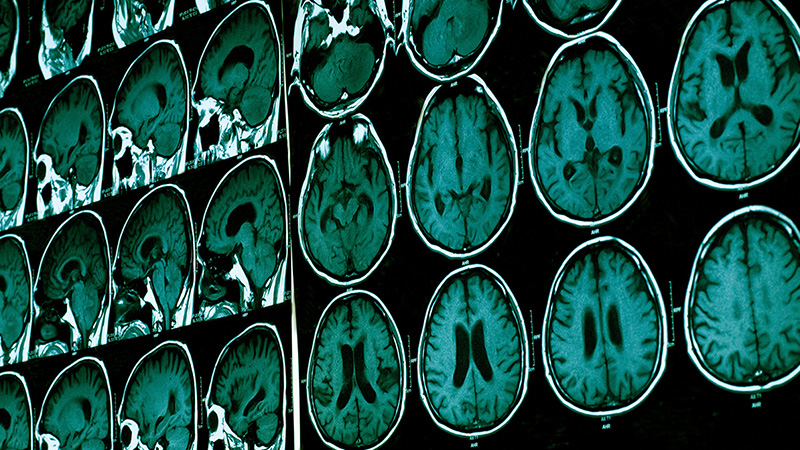
Neuropsychology
Collect and analyze spatiotemporal data to better understand alcoholism, autism, fibromyalgia and more.
Research Excellence
Our doctoral students regularly publish articles as first-authors in prestigious journals. Here are some recent publications:
- Ozturk, E. D., Zhang, Y., Lai, M. H. C., Sakamoto, M. S., Chanfreau-Coffinier, C., & Merritt, V. C. (2023). Measurement Invariance of the Neurobehavioral Symptom Inventory in Male and Female Million Veteran Program Enrollees Completing the Comprehensive Traumatic Brain Injury Evaluation. Assessment, 0(0).
- Caudle, M. M., Spadoni, A. D., Schiehser, D. M., Simmons, A. N., & Bomyea, J. (2023). Neural activity and network analysis for understanding reasoning using the matrix reasoning task. Cognitive processing, 24(4), 585–594.
- Edwards, L., Thomas, K. R., Weigand, A. J., Edmonds, E. C., Clark, A. L., Walker, K. S., Brenner, E. K., Nation, D. A., Maillard, P., Bondi, M. W., & Bangen, K. J., for the Alzheimer’s Disease Neuroimaging Initiative (2023). White matter hyperintensity volume and amyloid-PET synergistically impact memory independent of tau-PET in older adults without dementia. Journal of Alzheimer’s Disease: JAD, 94(2), 695–707.
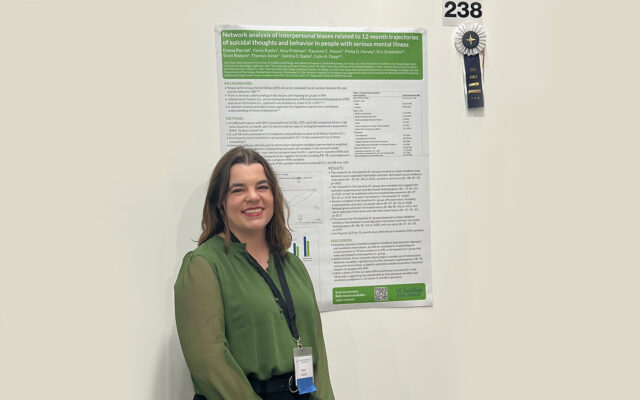
- Parrish, E. M., Quynh, A., Scott, V., Chalker, S. A., Chang, C., Kamarsu, S., Twamley, E. W., & Depp, C. A. (2023). Suicide Safety Plan Self-knowledge in Serious Mental Illness: Psychiatric Symptom Correlates and Effects of Brief Intervention. Community mental health journal, 59(8), 1639–1646.
- Clark, T. L., Savin, K. L., Perez-Ramirez, P., Valdez, T., Toba, G., & Gallo, L. C. (2023). eHealth weight loss interventions for adults with low income: A systematic review. Health psychology: official journal of the Division of Health Psychology, American Psychological Association, 42(6), 353–367.
Practicum Placements
All students complete their first clinical practicum at the SDSU Psychology Clinic. After the first practicum year at SDSU, students move to work within the broad array of practicum sites and diverse patient populations available to us through both universities and the affiliated VA San Diego Healthcare System and Rady Children’s Hospital. Clinical activities, integrated with more formal instruction at all levels, increase in responsibility and independence in the later years of the program as students acquire greater clinical proficiency.

Veterans Affairs San Diego Health Care

Rady Children's Hospital
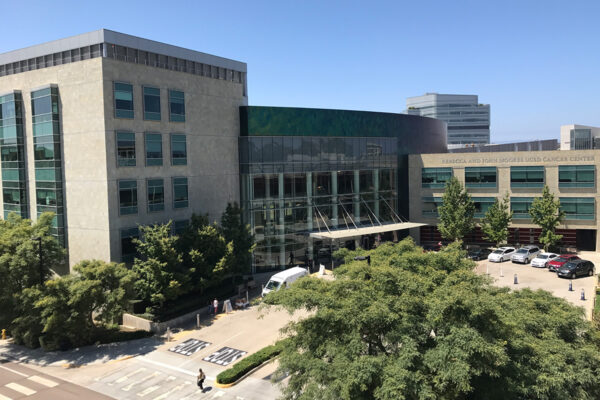
UC San Diego Health Centers
Commitment to Diversity & Inclusion
San Diego State University is designated as an Hispanic-Serving Institution and Asian American and Native American Pacific Islander-Serving Institution. Research projects and clinical practicum sites for the doctoral program provide opportunities to work with and on behalf of diverse populations.
The program's Justice, Equity, Diversity, and Inclusion (JEDI) Committee was initiated in 2019 as a student-led collaborative committee focused on diversifying the field of clinical psychology, improving culture-specific student training, and developing community outreach programs. For the JEDI Committee, diversity is broadly defined and includes identification by race, ethnicity, sexual orientation, gender, gender identity, ability/disability, religion, language, socioeconomic status, immigration status and age.